The goal of this lab session is to implement the Mapper algorithm and to explore various datasets.
Our goal here is to implement the algorithm for building Mapper from a point cloud. We provide a skeleton code in C++. Your task is to fill in the blanks in this code, and to test it on various datasets. We will proceed in several steps.
Q1. Fill the "Point" class. You will describe a point with:
Q2. Fill the "Cover" class. You will describe a cover with a vector of pair of double. You should also implement a constructor that takes an int (the resolution) and a double (the gain) as input.
We provide several reader functions:
Q3. Fill the count_cc function, which takes as input a graph G and an index id, and which outputs the set of connected components (cc) of G, indexed starting from id. The output is stored in a ConnectedComp, i.e. a map from integers (IDs of cc) to vectors of Point.
Hint: use a depth first search.
Q4. Fill the MapperElts function, which takes as input a graph G and a Cover I, and which outputs a vector of ConnectedComp, each element of the vector being the set of cc of a particular subgraph of the Cloud given by the preimage of a specific interval (or intersection of a pair of intervals) of the Cover.
Q5. Fill the build_mapper_graph function, which connects the nodes given by MapperElts and outputs the Mapper (i.e. a map from integers (IDs of nodes) to vectors of integers (IDs of neighbors)). A particular neighbor of a node should appear as many times in the node vector as there are cc in the corresponding intersection.
We provide the main function, which calls the previous functions to do the calculations. Note that it has another parameter, the so-called mask, which removes all nodes that contain fewer than a specified number of Cloud points. The output is a .dot file (standard format for graphs), called mapper.dot.
You can use the Graphviz library to visualize the .dot file. You need to download the library Download page (executable packages are available for Linux, Mac and Windows). Once the library installed, you can type neato -Tpdf mapper.dot -o mapper.pdf in a terminal to produce a .pdf of the visualized graph.
Note: at this stage you will have no color in the output graph. If you want colors, you have to assign a color to each node, depending on (say) the average of the filter values over the set of data points represented by the node.
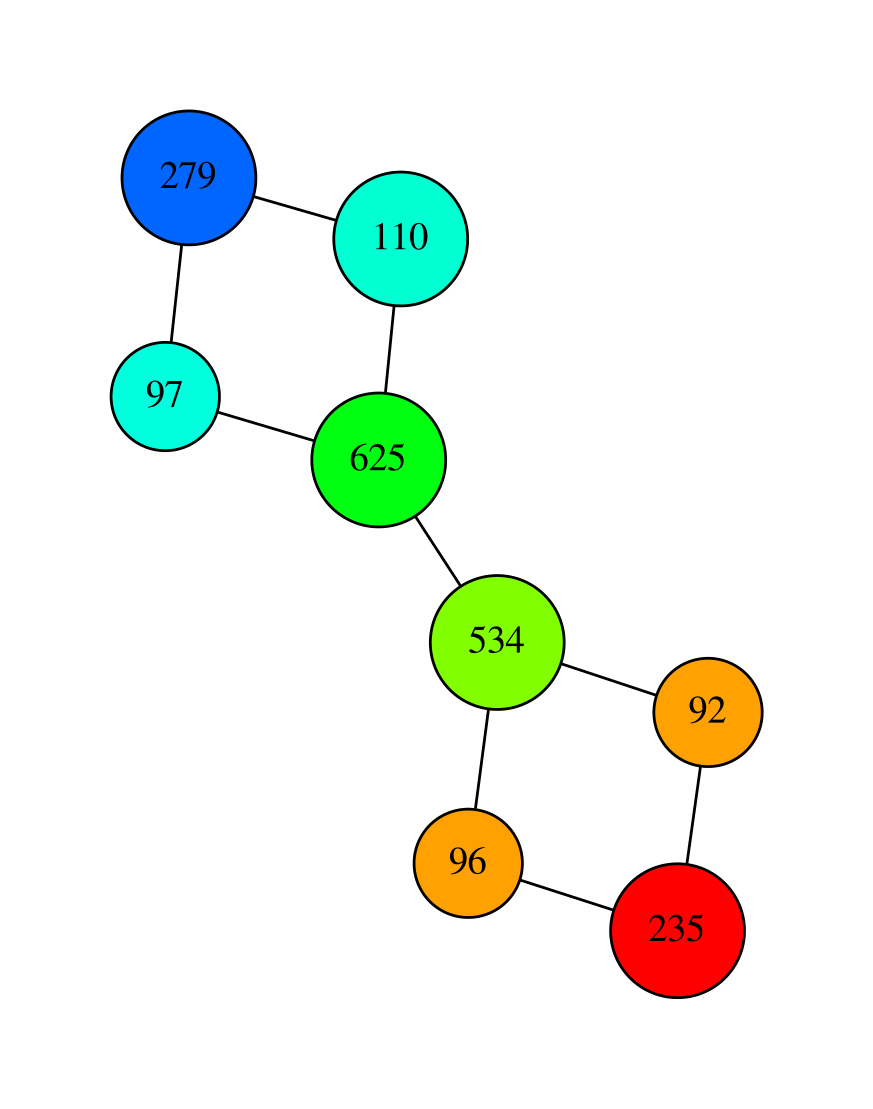
Q6. Use the code and find a good cover to compute a skeleton of the double torus that has the correct vertical homology for the z-coordinate function (3rd column). Try also to compute a skeleton of one of the 3D shapes of TD6, using the z-coordinate function again (2nd column). Here are two possible skeletons:
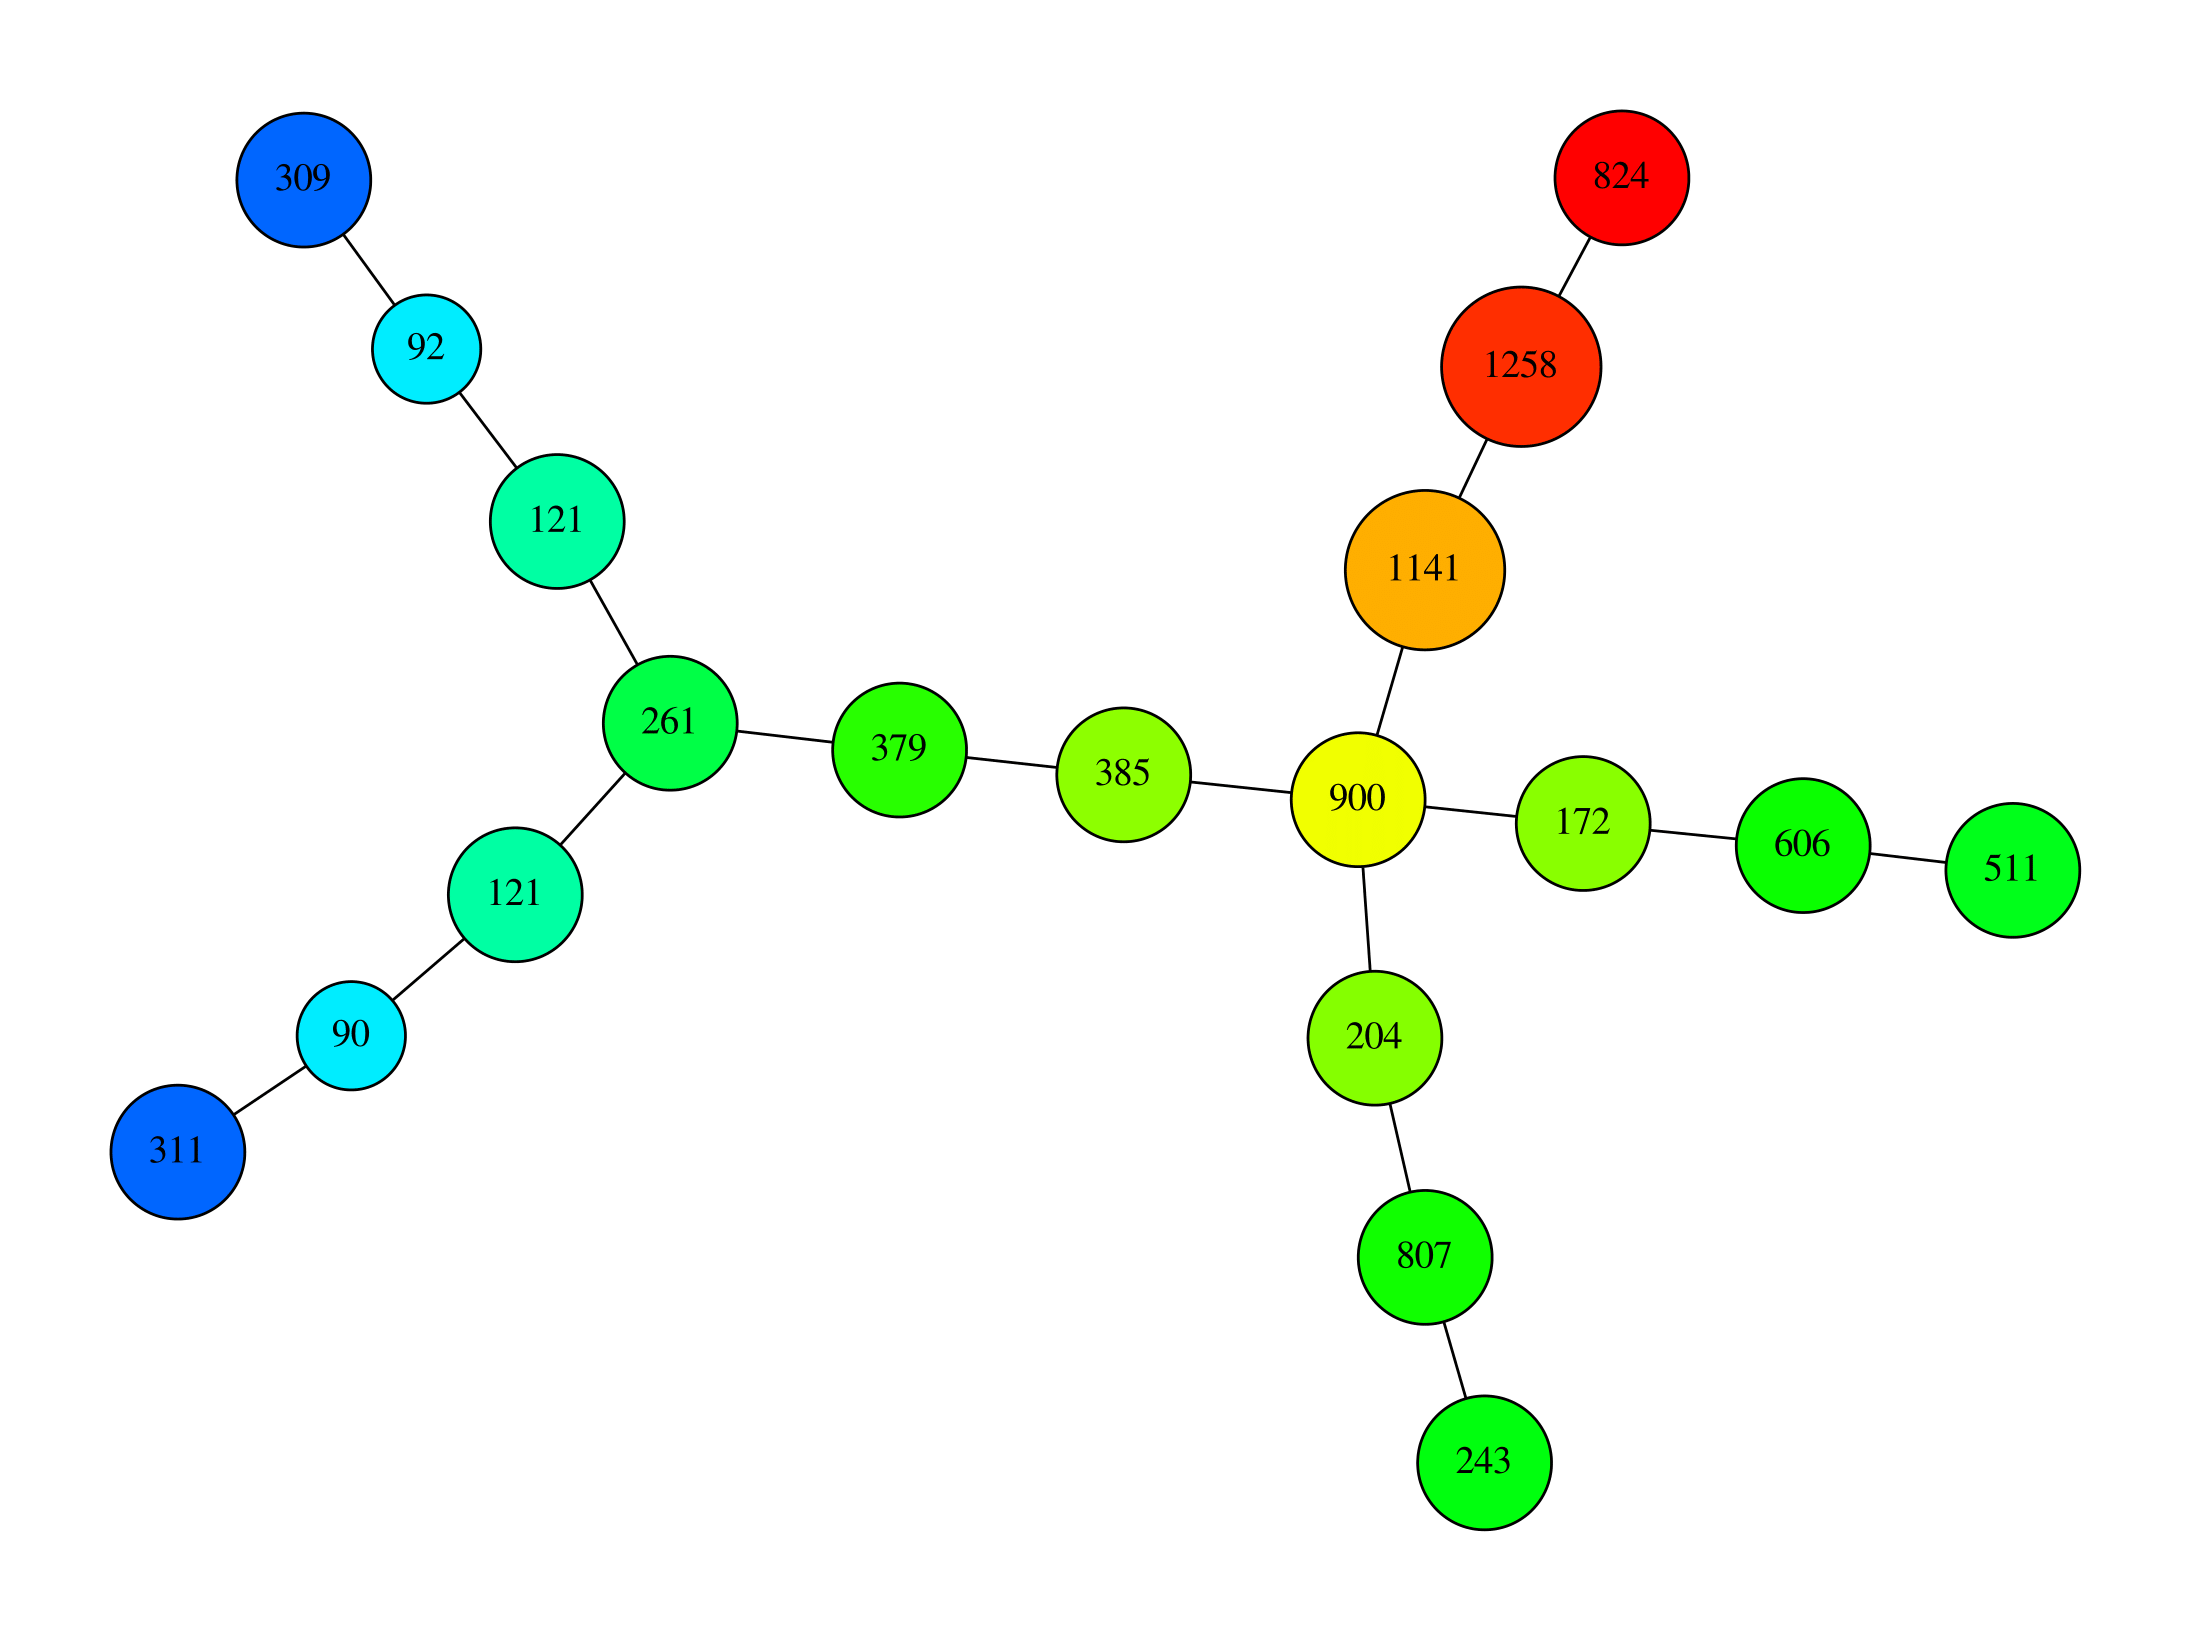
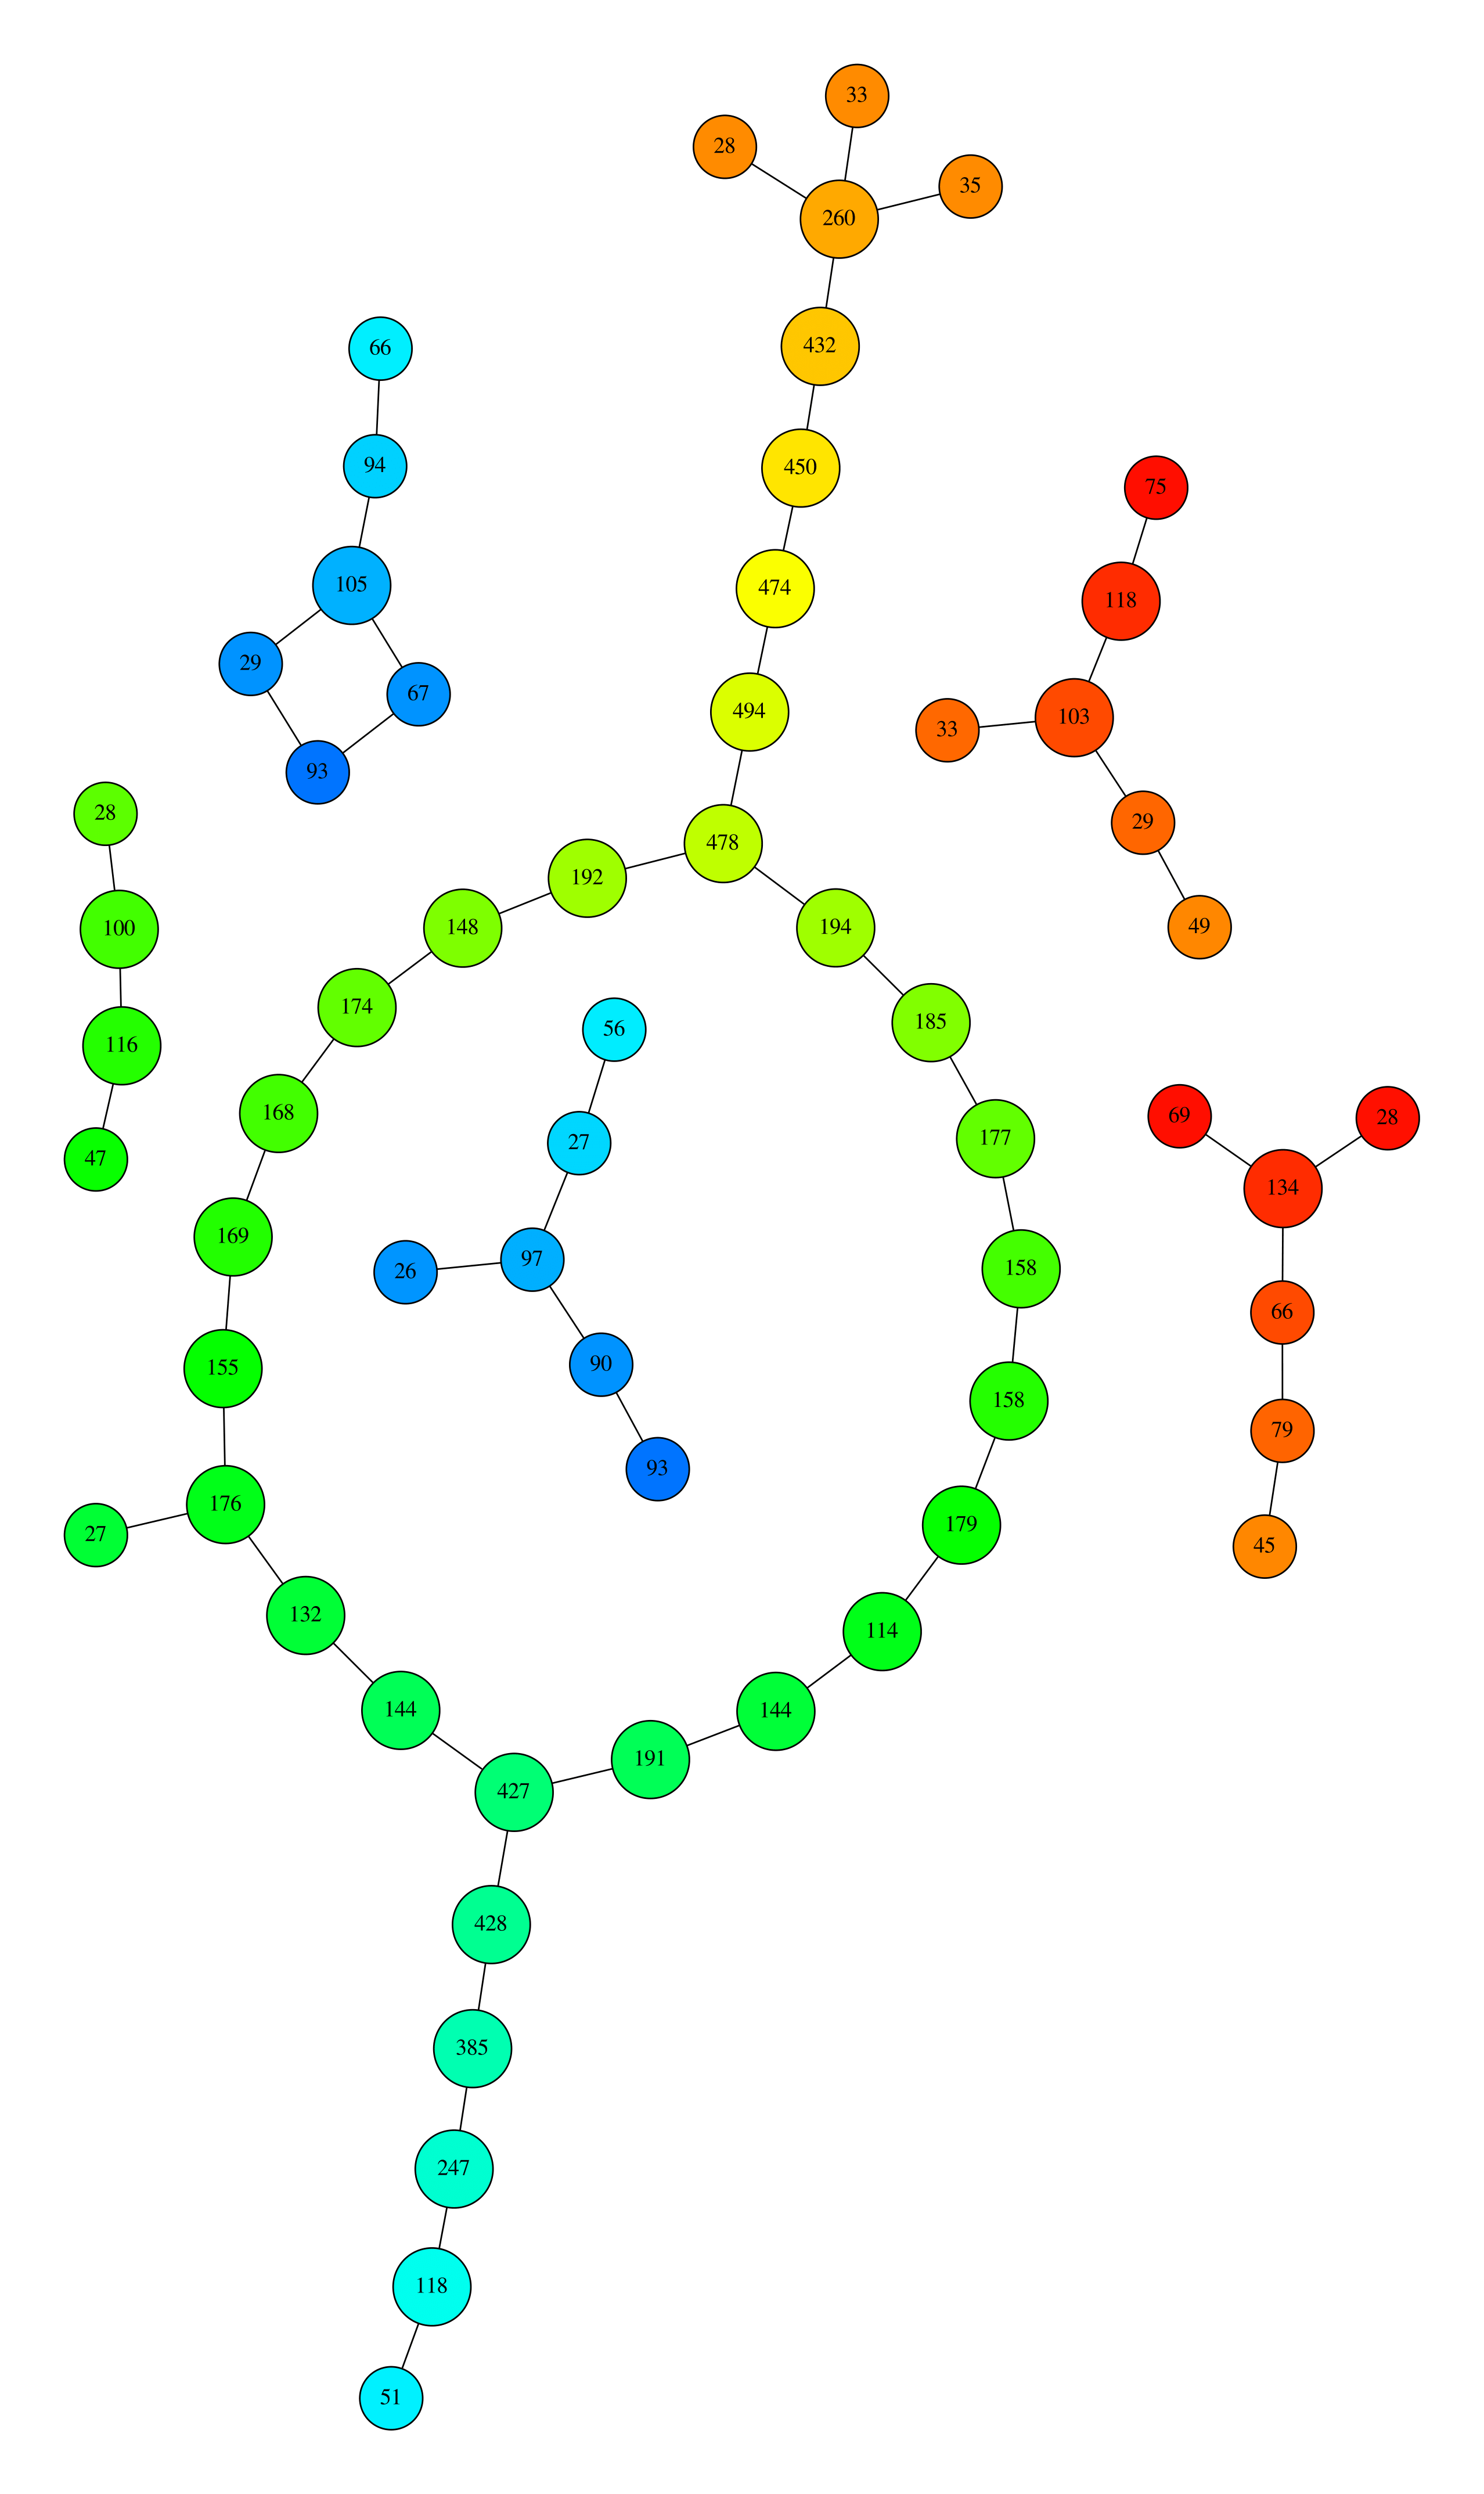
Q7. Test various covers and neighborhood graphs to retrieve the topological structure of the crater of TD1. You can use the x-coordinate or the density function as filter. Here are two possible skeletons. Can you guess which function was used as a filter for each image, and explain the shape of the Mapper graph?

Q8. Test various parameters and filters to explore the topological structure of the natural images and the NBA datasets from TD1.